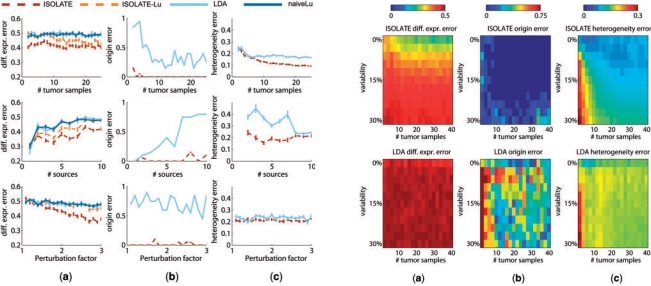
Fig. 4.
Performance of ISOLATE and LDA on synthetic datasets. Each row represents a different parameter tuned: the number of heterogeneous tumor samples, the number of sources (non-cancer) in the Source Panel and the perturbation factor of the differentially expressed genes (manipulating the number of perturbed genes within the range of 50–500 genes did not result in changes in performance to either model and are not shown). Each column represents a different performance metric applied to each dataset. (a) Differential expression error, (b) origin error and (c) heterogeneity error are as defined in Section 3. Two additional models are plotted in (a): ISOLATE-Lu is the performance achieved when applying the same method as ICA for identifying differentially expressed genes (Lu et al., 2005) to the output of the ISOLATE model, and naiveLu is the performance achieved when directly comparing the heterogeneous tumor expression profiles to the site of origin to identify differentially expressed genes, without accounting for sample heterogeneity.

