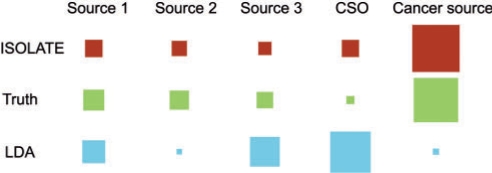
Fig. 6.
An example of heterogeneity error for a single tumor sample. Here, we illustrate a representative tumor sample whose mixing proportions of component sources were estimated by ISOLATE (top row) and LDA (bottom row), compared with the actual values (middle row). Each of the four columns on the left represent a source from the Source Panel (Sources 1–3, as well as the site of origin source), while the right-most fifth column represents the cancer cells. The area of each square is proportional to the fraction of the sample composed of that particular source. Whereas ISOLATE estimated mixing proportions fairly close to the truth, the LDA estimate of the CSO and cancer sources were quite erroneous.

