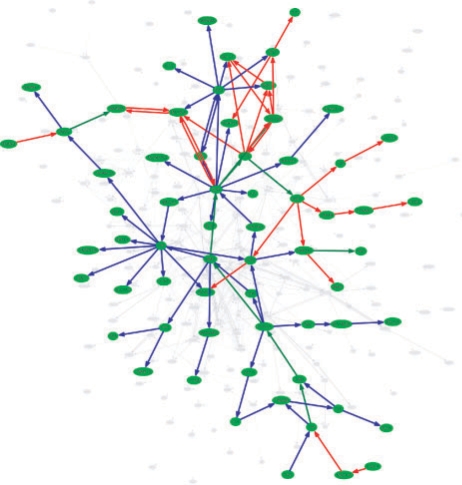
Fig. 3.
BiNA visualization of the two patients A (blue, survival time 477 weeks) and B (red, survival time 41 weeks). Edges on significant paths in both tumors are colored green. The network shows the relevant part of the complete consensus network, whereas the non-relevant part of the consensus network is presented by gray edges and nodes in the background.

