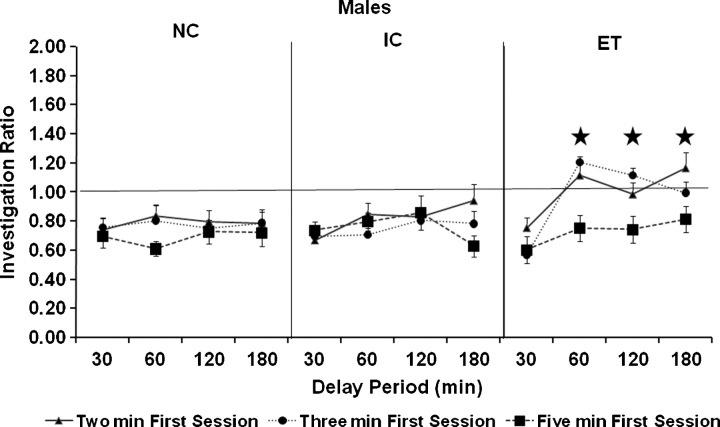
Fig. 2.
Mean investigation ratio in males. Error bars represent SEMs. Stars indicate the delay intervals where the ratio of the ET males was greater than both the NC and IC males, regardless of the duration of the first session. This effect was most prominent when the duration of the first session was 2 or 3 min.

