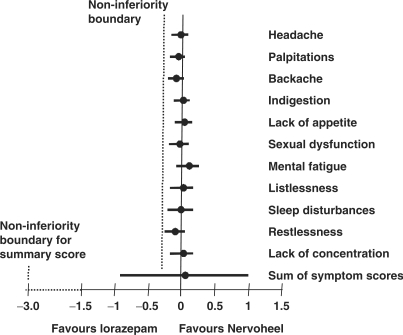
Figure 3.
Differences (± 95% confidence intervals) between the treatment groups in change from baseline to last observation for all individual variables and the sum of all variables. The border for non-inferiority for Nervoheel N compared with lorazepam for the individual variables (−0.3) is marked by a dotted line. For the sum of all scores, the non-inferiority was −3.0 and is not drawn to scale in the figure.

