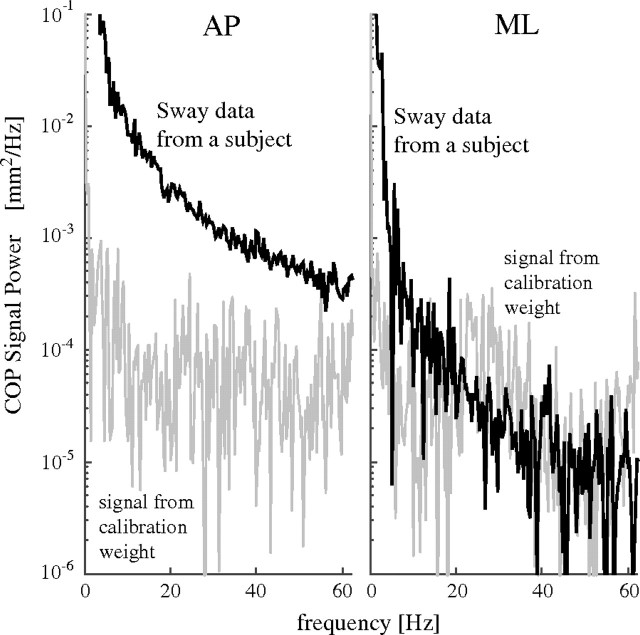
Figure 1.
Power spectral density of center of pressure (COP) time series from a nonfrail participant (black) and of the calibration signal (gray) in the anteroposterior (AP) and mediolateral (ML) directions. The signal-to-noise ratio between 7.5 and 60 Hz in the AP direction (top) is more than 10, but in ML direction, it is less than 1. Therefore, no further analyses of the COP time series in the ML direction were performed.

