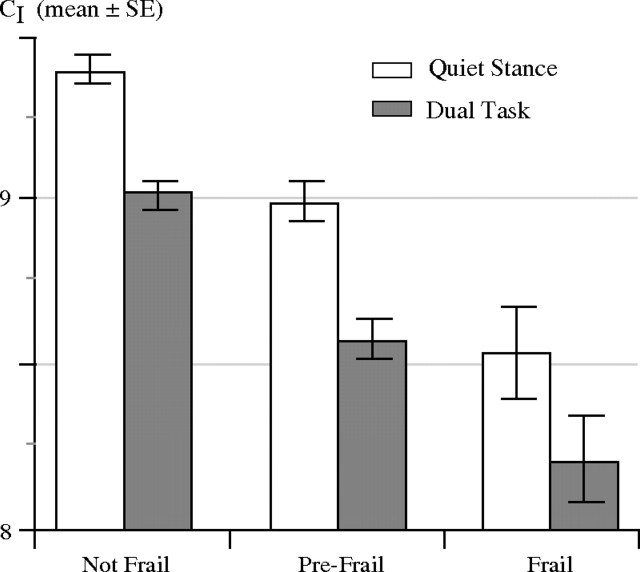
Figure 4.
Complexity indices (CI) for nonfrail, prefrail, and frail groups during quiet standing and dual-task conditions. Solid bars and error bars represent group mean values and standard errors, respectively. The CI for the frail (p = .003; post hoc LSD) and prefrail (p < .001) groups were lower than for the nonfrail group and dropped further with dual task (p < .001). Prefrail and frail groups were not different (p = .2).

