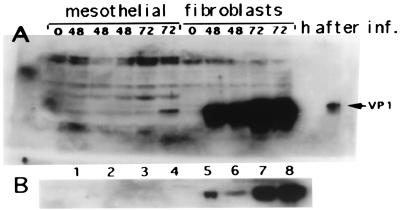
Figure 4.
Western blot for SV40 VP1 in HM3 and WI38 after infection with SV40. Blots were developed by enhanced chemiluminescence. (A) VP-1 in the total cell extracts (100 μg per lane). (B) VP1 in the tissue culture medium (samples were normalized for number of Tag-positive cells). Lanes: 1 and 2, HM 48 h after infection; 3 and 4, HM 72 h after infection; 5 and 6, HF 48 h after infection; 7 and 8, HF 72 h after infection. Each lane represents an independent infection experiment. Almost identical results were obtained with all of the other HM and HF. Cell extracts were normalized for number of Tag-positive cells.

