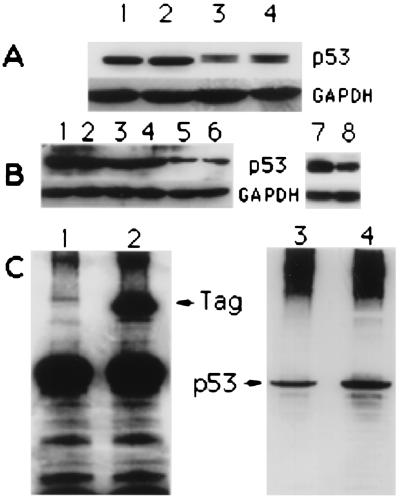
Figure 5.
(A) p53 expression in HM and HF. One hundred micrograms of total protein extracts was loaded into each lane. GAPDH, glyceraldehyde-3-phosphate dehydrogenase. Lanes: 1, HM2; 2, HM3; 3, WI38; 4, CCD1069Sk [HM1 and MRC5 (not shown) produced almost identical results]. (B) Lanes 1–6, p53 expression in untreated HM (lanes 1 and 2), HM treated with 5 μM scrambled oligo (lanes 3 and 4), and HM treated with 5 μM antisense p53 oligo (lanes 5 and 6). Cells were harvested and lysed 48 h after the onset of treatment; 100 μg of total protein extracts was loaded per lane (each lane represent an independent experiment). Lanes 7 and 8, p53 expression in HM 5 days after treatment (and 72 h after SV40 infection) with scrambled oligos (lane 7) and antisense p53 (lane 8). (C) Lanes 1 and 2, Tag immunoprecipitation in SV40-infected HM. Lane 1, scrambled control oligo-treated HM; lane 2, antisense p53-treated HM. Tag was precipitated with the monoclonal anti-Tag AB-1 (Tag amino terminus). The membrane was probed with the monoclonal anti-Tag AB-2 (Tag carboxyl terminus), followed by monoclonal anti-mouse IgG conjugated with horseradish peroxidase. Lanes 3 and 4, Tag/p53 coimmunoprecipitation. The membrane shown on the left was stripped of antibodies and probed with the monoclonal anti-p53 DO-1 directly conjugated with horseradish peroxidase. Lane 3, control oligo-treated HM; lane 4, antisense p53-treated HM.

