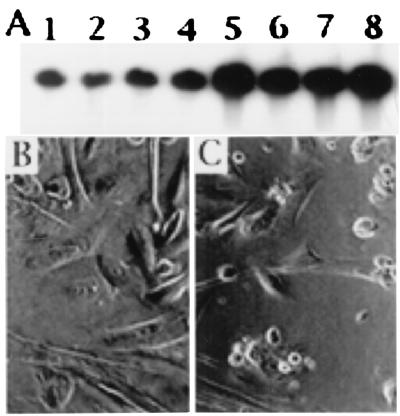
Figure 6.
(A) Southern blot analysis of SV40 DNA synthesis in SV40-infected HM3 cells treated with a control scrambled oligo (5 μM) (lanes 1–4) and treated with antisense p53 (5 μM) (lanes 5–8). Almost identical results were obtained with HM2; HM1 were not tested. (B and C) HM2 treated with control scrambled oligo (B; 25 μM); or antisense p53 (C; 25 μM) and infected 48 h later with SV40. Cells are shown 72 h after infection. In C, note empty spaces because of lysis in cells treated with antisense p53. Little or no cell lysis was observed in cells treated with control oligos (B). (Original magnification, ×400.)

