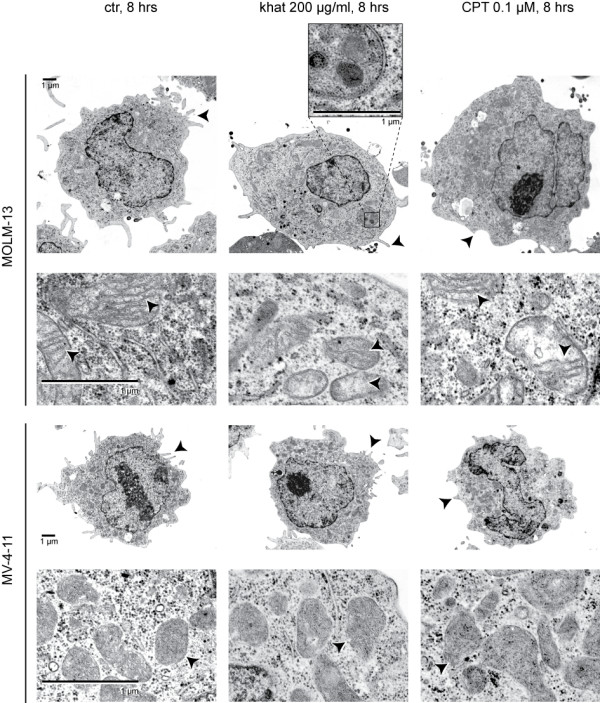
Figure 2.

Khat and CPT induced distinct ultrastructural features in MOLM-13 and MV-4-11. MOLM-13 and MV-4-11 cells were exposed to 200 μg/ml khat and 0.1 μM CPT for 8 hours and prepared for transmission electron microscopy, see Methods for experimental details. Arrows indicate different ultrastructural features of microvilli and mitochondria. A double-membrane autophagosome is enlarged in the insert. The cells selected for this figure were either apparently unaffected or in early phases of cell death. Images of cells in late cell death are not shown.
