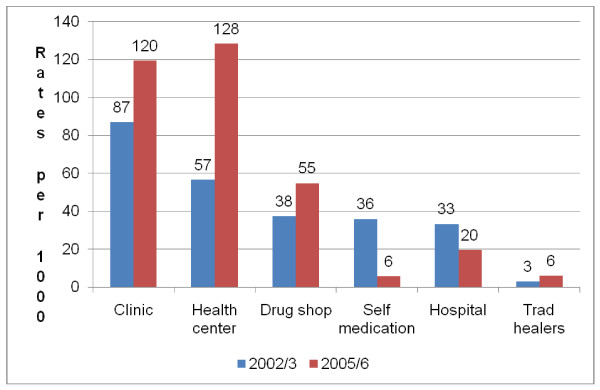
Figure 2.
Sources of care among the most poor residents (UNHS 2002/03 and 2005/06). Chart showing health care utilisation rates for respondents in the most poor households by source of care based on secondary data analysis of the Uganda National Household Survey data from two surveys in 2002/3 and 2005/6.

