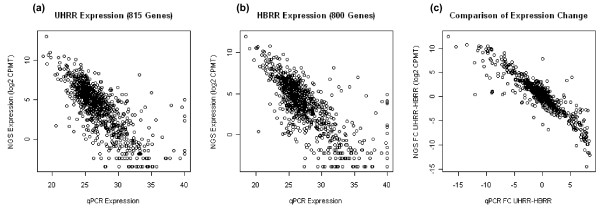
Figure 4.
Scatter plot of gene expression level measurements using the 3' tag DGE and qPCR technologies, for (4a) UHRR sample, (4b) HBRR sample, and (4c) UHRR vs. HBRR differential expression. The gene expression levels from qPCR are represented by PCR cycle number, and the expression levels from DGE are represented by Log2 of CPMT (counts per million tags)

