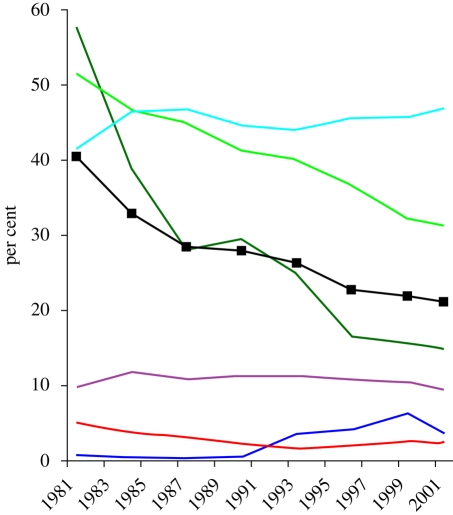
Figure 3.
Percentage living on less than $1 per day. Dark green, East Asia; dark blue, Eastern Europe and Central Asia; purple, Latin America; red, Middle East and North Africa; light green, South Asia; light blue, Sub-Saharan Africa; black line with filled square, World. Source: ‘How have the world's poorest fared since the early 1980s?’ by Shaohua Chen and Martin Ravallion. See http://econ.worldbank.org/external/default/main?

