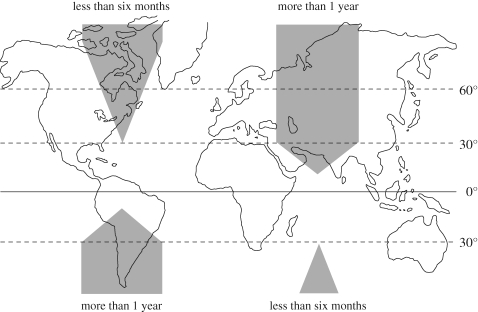
Figure 3.
A theoretical scheme relating the use or disuse of photoperiodic cueing to latitude and lifespan. The shaded areas indicate the proportion of populations using photoperiod to time their seasonal reproduction for species whose life expectancy is less than six months versus more than 1 year (adapted from Bronson 1989).

