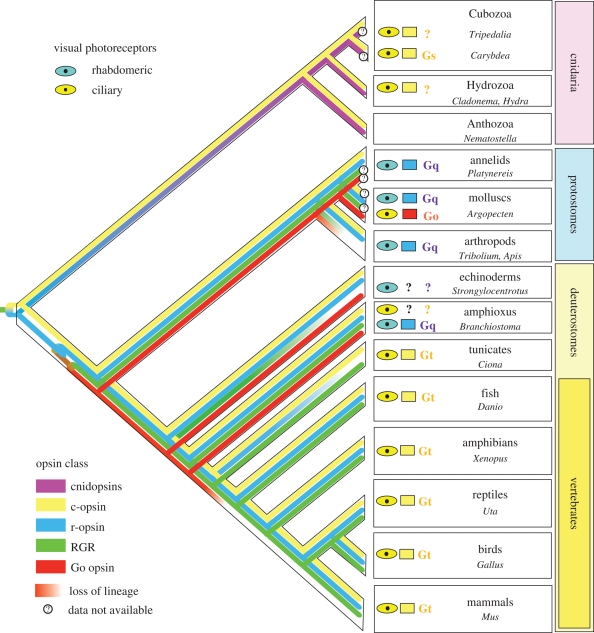
Figure 1.
A schematic diagram of opsin distribution among eyes in different animal phyla. Particular opsins subfamilies are distinguished by different colouring. The lines leading to different phyla depict the hypothetical evolutionary fate of given opsin lineage based on available genomic and other data. The question mark denotes such animals where the presence of a given opsin lineage has not been confirmed yet. The colour of the eye-like pictogram corresponds to the type of photoreceptor cell employed in the eye. The class of opsin employed in the eye is represented by the colour of the rectangle next to the eye-like pictogram. If known, the Gα subunit interacting with the opsin is shown. Note that a small subset of vertebrate retinal ganglion cells expresses melanopsin coupled to a Gq signalling cascade (Panda et al. 2005). Although these cells fulfil the definition of a minimal eye, they are not the major photoreceptors of the eye and are not considered in this figure.

