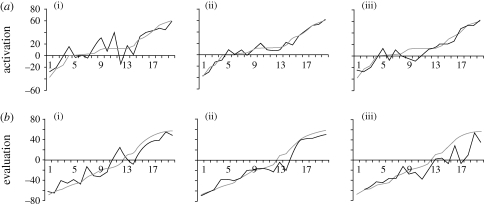
Figure 2.
Multi-modal effects in the Belfast Naturalistic Database. Each panel shows average dimensional ratings for the audiovisual versions of the clips (black line) and one of the partial versions (grey dark line). (a) Activation ratings and (b) evaluation. (a,b) (i) Visual; (ii) audio; (iii) audio filtered.

