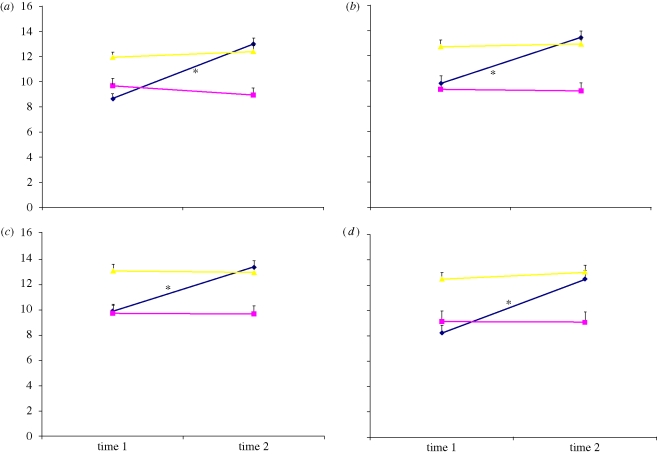
Figure 3.
Graphs to show mean scores (with standard error bars) for each group on the four tasks. (a) Situation–expression matching task—level 1. (b) Situation–expression matching task—level 2. (c) Situation–expression matching task—level 3. (d) Emotional vocabulary task. *p < 0.001. Blue, ASC intervention group; Magenta, ASC control group; yellow, typical control group.

