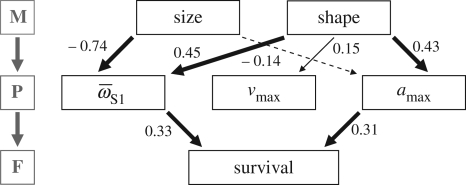
Figure 2.
M–P–F pathway for G. hubbsi in the presence of predatory fish. Path coefficients represent standardized performance (M–P) and fitness gradients (P–F). Paths selected using AIC, line thickness reflects the strength of the path, solid lines represent positive effects and dashed lines represent negative effects. Size: centroid size; shape: lateral shape axis (ranging from small to large caudal regions); other abbreviations follow the text.

