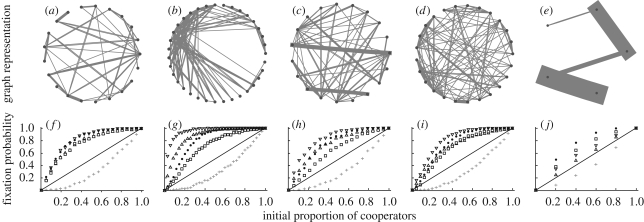
Figure 1.
Fixation of cooperation in primate groups. (a–e) Structures of the five groups that produced the highest fixation difference (FD). (f–j) Fixation probability for cooperation on the structured system (black dots), well-mixed population of the same size (grey crosses) and random networks (type 1: squares; type 2: up-triangles; type 3: down-triangles). The solid line indicates the expectation for random drift given neutral selection.

