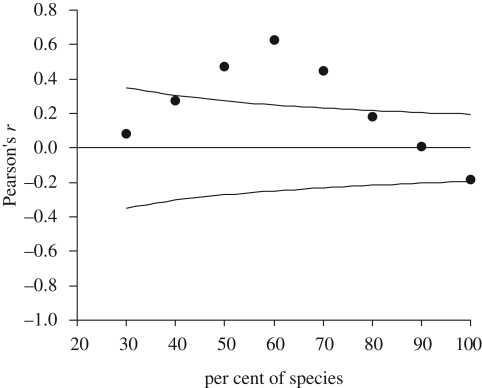
Figure 1.
Pearson's correlation coefficients between local abundance and national distribution (uncorrected for sampling effort) of Finnish butterflies in relation to the percentage of species included in the analysis; species were entered in order of decreasing national distribution. The horizontal line represents correlation coefficient 0 and the curved lines represent the area above and under which the correlation coefficients are significantly different from zero.

