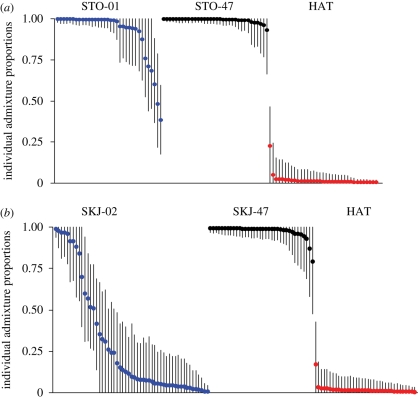
Figure 2.
Individual admixture proportions and 90 per cent credible intervals, estimated using Structure 2.2. A value of 1 corresponds to a ‘pure’ indigenous trout and 0 to a ‘pure’ hatchery trout. Contemporary samples are denoted by blue, historical samples by black and hatchery trout by red. (a) Analysis of the STO population and (b) analysis of the SKJ population.

