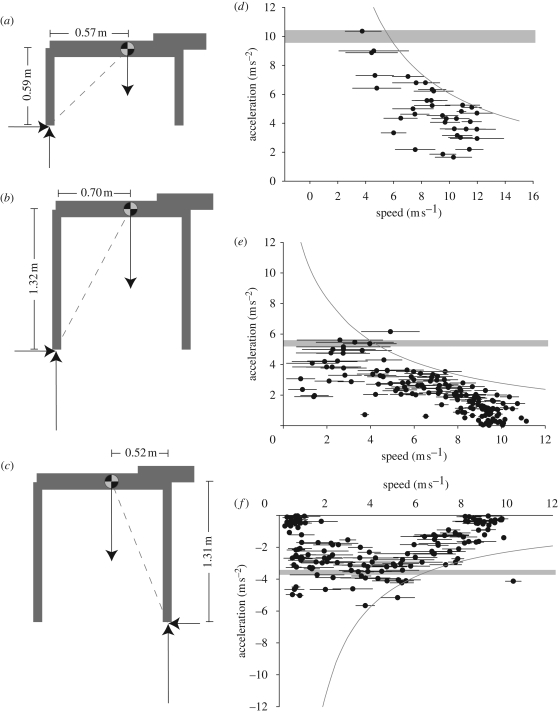
Figure 2.
(a–c). The body geometry used to create limiting stride-averaged accelerations for maximally accelerating greyhounds and accelerating and decelerating horses. The maximum net nose-up (a,b) or tail-up (c) pitching acceleration is determined by constraining the total ground force vector (dotted line) to be at the mean (mid-stance) hind (a,b) or fore (c) foot position and assuming that geometry is largely constant. The resulting maximum acceleration (d,e) and deceleration (f) predictions are indicated by horizontal grey bars. Bar thickness denotes 1 s.d. due to the range of body geometry measured (n = 5, horses and dogs). (d) Acceleration data for greyhounds (70 strides, 10 dogs). (e) Accelerating polo ponies (160 strides, five ponies). (f) Decelerating polo ponies (160 strides, five ponies). Each data point indicates mean speed and mean acceleration for a single stride; bar ends denote initial and final velocity of the stride. At low speeds, maximal accelerations are consistent with pitch avoidance. At higher speeds, lower maximum accelerations are achieved, consistent with a power constraint. Body-mass specific power requirements for the curves are 60, 30 and −23 W kg−1 for figure parts d–f, respectively.

