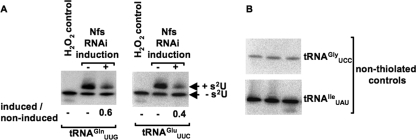
FIGURE 5.
Effect on tRNA steady-state levels is not because of decreased transcription. A, RNA isolated from noninduced and RNAi-induced Nfs cells was run on an APM gel followed by Northern blot analysis. Bands corresponding to thiolated tRNA and nonthiolated tRNAs are indicated. H2O2 is used as a control to show complete oxidation of thiolation, eliminating the mobility shift. The ratio of total tRNA isolated from RNAi-induced (+) to noninduced (−) cells after standardizing, with nonthiolated tRNAs (nonthiolated controls) (B), is shown below each panel, where a ratio of 1 would indicate no change, and less than 1 indicates lower steady-state levels of a particular tRNA.

