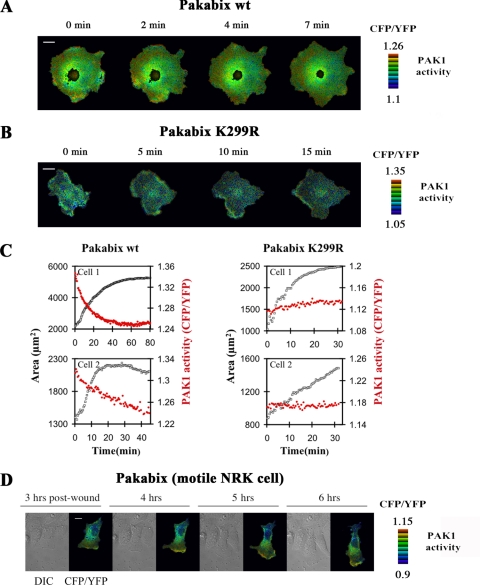
FIGURE 4.
Spatiotemporal PAK1 activity during cell spreading and motility. A, a representative COS-7 cell expressing Pakabix was imaged by FRET wide-field videomicroscopy during spreading on fibronectin-coated dishes. Time 0 is the beginning of the video recording, ∼15 min after re-plating. Selected time points are shown as indicated. For the entire time-lapse video sequence, see supplemental movie 1. B, time-lapse FRET imaging of control kinase-dead mutant Pakabix K299R (see supplemental movie 2). C, whole cell areas (black squares) and whole cell FRET (red circles) measurements were plotted against the different time-points of spreading for two representative cells transfected with Pakabix or with control Pakabix K299R. D, a motile NRK cell was imaged in a wound-healing assay. Selected post-wound time points are shown (see supplemental movie 3). Scale bar, 10 μm.

