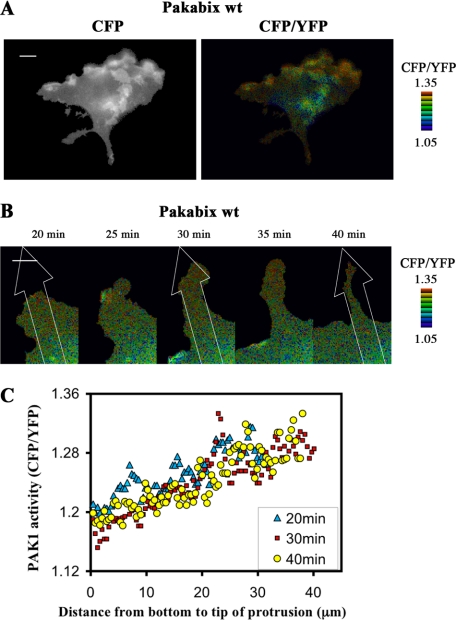
FIGURE 6.
PAK1 activity at membrane ruffles and at isolated protrusions. A, selected image (10-min time point) from time-lapse FRET imaging of a Pakabix-transfected spreading cell with elevated ruffling activity (see supplemental movie 4). B, time-lapse FRET imaging of an isolated protrusion of a Pakabix-expressing cell (see supplemental movie 4). C, gradient of PAK1 activity along the protrusion. The line-scan function of MetaMorph software was used to measure FRET along strips (40 μm long and 8.2 μm wide) at three time points, as indicated in panel B. Scale bar, 10 μm.

