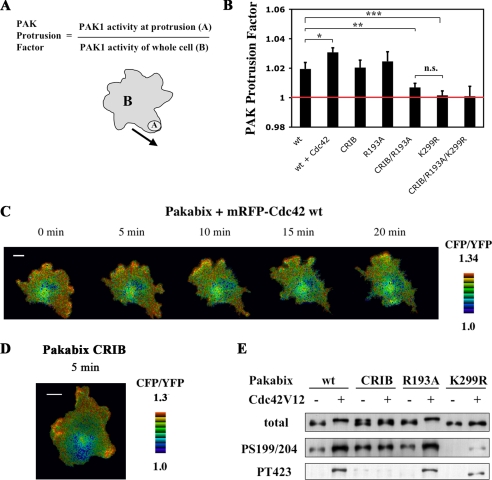
FIGURE 7.
Analysis of Pakabix mutants in spreading cells. A, quantification method for local PAK1 activation via the “PAK Protrusion Factor.” The “PAK1 activity at protrusion” and the “PAK1 activity of whole cell” were measured as the CFP/YFP ratios of the region of interest “A” and of the whole cell “B”, respectively. B, the PAK protrusion factor of Pakabix wild-type was compared with those of Pakabix + Cdc42 wild-type, and of various Pakabix mutants. For each cell, one to three protrusions were analyzed; number of protrusions n ≥ 14 per condition. Bars represent ± S.E. ***, p < 0.001; **, p < 0.005; *, p = 0.064, n.s. = not significant, according to Student's t test. C, time-lapse FRET imaging of Pakabix in presence of co-expressed mRFP-Cdc42 wild-type (see supplemental movie 6). D, selected image (5-min time point) from time-lapse FRET imaging of Pakabix CRIB mutant (see supplemental movie 7). E, phosphorylation status of the Pakabix mutants. The CRIB mutant is deficient in GTPase binding; the R193A mutant is deficient in PIX binding; the K299R mutant is kinase-dead.

