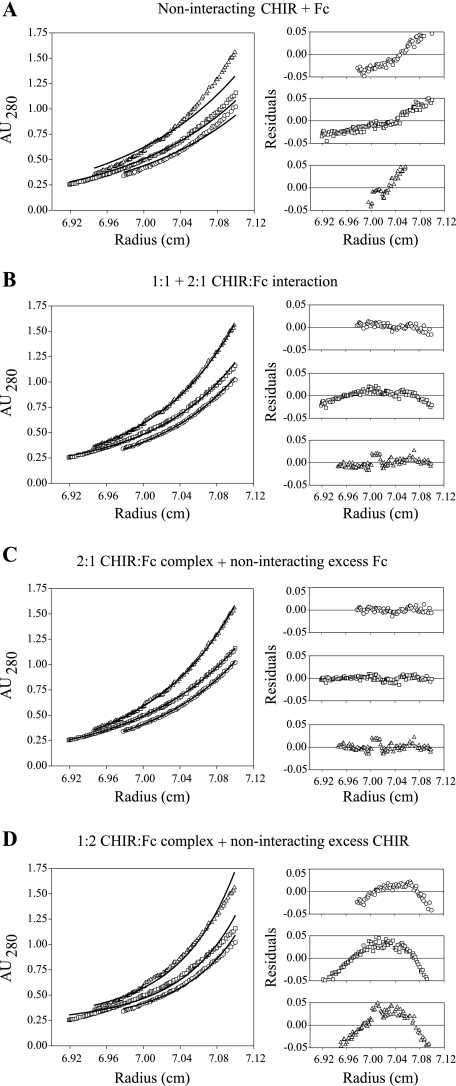
FIGURE 2.
Sedimentation equilibrium of monomeric CHIR-AB1 and IgY-Fc. Sedimentation equilibrium analyses of mixtures of smCHIR-AB1 and Fcυ2–4; the data acquired at 10,000 rpm are shown fitted to a selection of models. The three cells containing different ratios of Fcυ2–4:smCHIR-AB1 were fitted simultaneously to each model using Sigmaplot as described previously (27), and the three sets of residuals are shown for each fit (1:1, 2:1, and 1:2 Fc:CHIR mixtures are shown as circles, squares, and triangles, respectively). The models represent the following: A, a noninteracting mix of smCHIR-AB1 and Fcυ2–4; B, a 1:1 and 2:1 equilibrium between smCHIR-AB1 and Fcυ2–4; C, a mixture of 2:1 smCHIR-AB1-Fcυ2–4 complex and excess noninteracting Fcυ2–4; and D, a mixture of 1:2 smCHIR-AB1-Fcυ2–4 complex and excess noninteracting smCHIR-AB1. It is clear that only C shows residuals randomly distributed around zero, and it was found to be the only model that fitted the data well. The data at 8,500 and 12,000 rpm were also found to fit only to this model (not shown).

