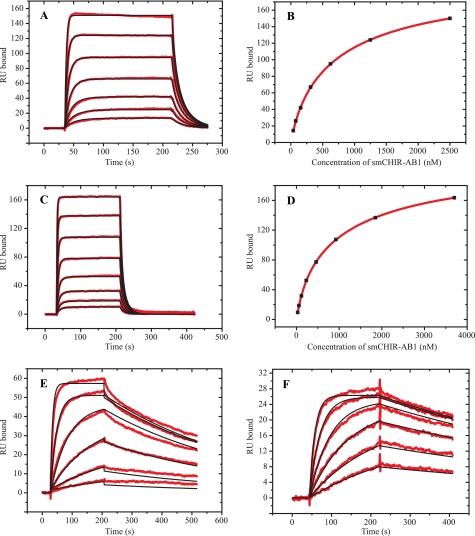
FIGURE 4.
SPR measurement of CHIR-AB1 binding to IgY and IgY-Fc. A, an SPR sensorgram and fit, using a heterogeneous ligand model, of 39–2500 nm smCHIR-AB1 binding to anti-protein A yolk IgY captured on protein A immobilized to a CM5 sensor chip. B, binding curve using Req in RU from A for bound smCHIR-AB1 and nanomolar concentration of analyte for free smCHIR-AB1. C, sensorgram and fit, using a heterogeneous ligand model, of 32–4000 nm smCHIR-AB1 binding to serum IgY immobilized on a CM5 sensor chip. D, binding curve using Req in RU from C for bound smCHIR-AB1 and nanomolar concentration of analyte for free smCHIR-AB1. E, sensorgram and fit, using a 1:1 binding model, of 2.8–687 nm serum IgY binding to sfpCHIR-AB1 immobilized on a CM5 sensor chip. F, sensorgram and fit, using a 1:1 binding model, of 3–100 nm Fcυ2–4 binding to sfpCHIR-AB1 immobilized on a CM5 sensor chip.

