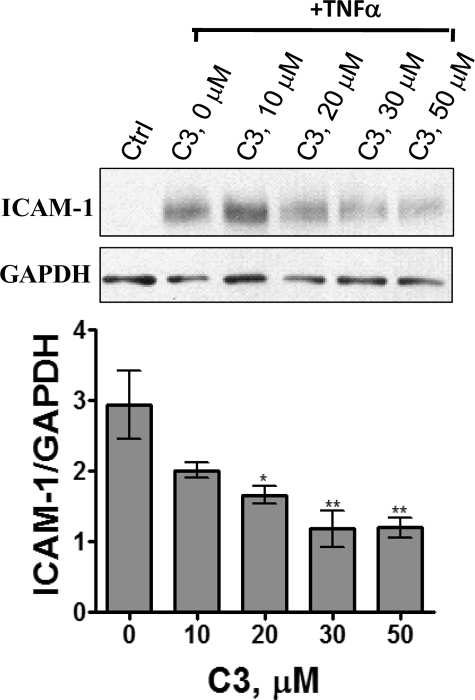
FIGURE 4.
Concentration-dependent inhibition of TNFα-induced expression of ICAM-1 by C3. A549 cells, treated with varied concentrations of C3 for 4 h were stimulated with TNFα (10 ng/ml) for 6 h before quenching the cells and analyzing the cell extract by Western blot analysis using ICAM-1 and GAPDH antibodies. The band intensities of ICAM-1 and glyceraldehyde-3-phosphate dehydrogenase (GAPDH) were determined by densitometry. The graph shows the mean ± S.E. of the ratio (n = 4; *, p < 0.05; **, p < 0.01).

