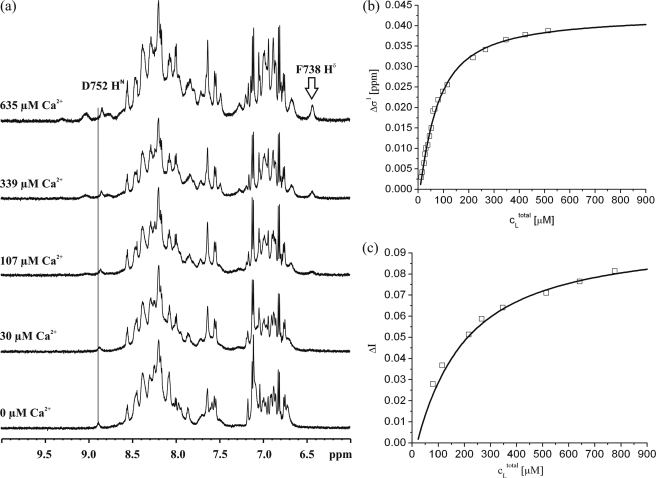
FIGURE 8.
Ca2+ affinity measurements by NMR spectroscopy. a, Ca2+-induced spectral changes observed in a sample of 40 μm polycystin-2-(680–796) in 5 mm Tris-HCl, pH 6.8, 500 mm NaCl, 2 mm dithioerythritol, and 0.1 mm DSS containing 90% H2O and 10% D2O. The temperature was 293 K. The initial calcium concentration was 9.2 μm, the concentrations of CaCl2 added are indicated. The position of the amide proton resonance frequency of Asp-752 at 9.2 μm CaCl2 is depicted by a vertical line crossing all one-dimensional spectra. b, chemical shift change Δδ1 of the amide proton of Asp-752 was plotted as a function of the Ca2+ concentration. c, the change of the peak volume ΔδI2 of the amide resonance of Phe-738 is plotted as a function of the calcium concentration. The curves shown represent a fit of the data assuming a two site model (Equations 3 and 4).The resulting parameters are given in Table 2.

