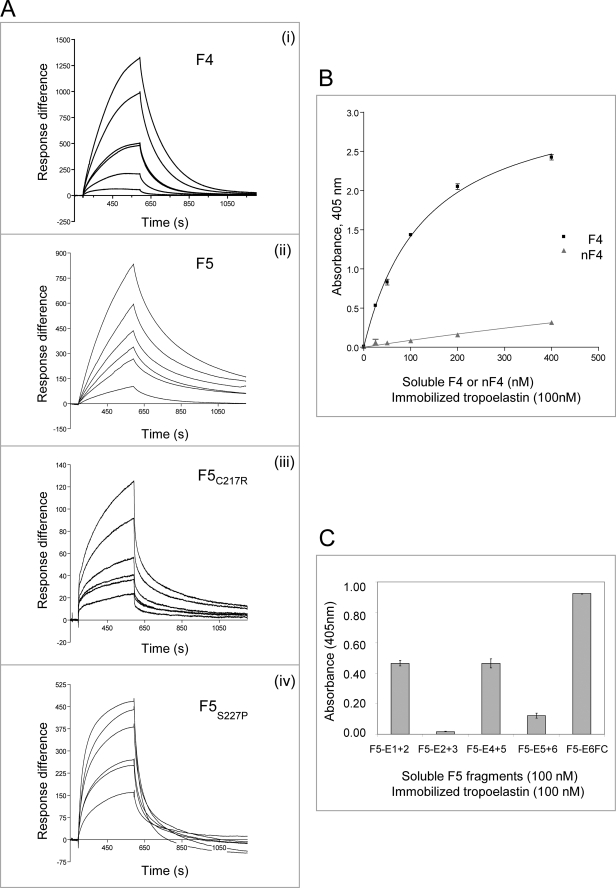
FIGURE 3.
Molecular interactions of tropoelastin with fibulin-4 and -5. A, BIAcore analysis of interactions of immobilized tropoelastin with full-length fibulin-4 (F4) (i) or fibulin-5 (F5, F5C217R, or F5S227P) (ii–iv). These soluble ligands were injected over tropoelastin immobilized on a CM5 chip (see Table 2). Each sensorgram shows analyte concentrations ranging from 2 to 10 μg/ml (for F4) or from 0.4 to 10 μg/ml (for F5), with duplicate concentrations included in every run. One representative experiment is shown. Response difference is the difference between experimental and control flow cells, in response units. Time is shown in seconds. F4, F5C217R, and F5S227P showed faster dissociation than F5 from tropoelastin. B, solid phase binding curves showing that soluble biotinylated F4 bound strongly to immobilized tropoelastin but nF4 binding was very weak. One representative experiment is shown. Data are shown with the negative (biotinylated F4 only) control subtracted. Results are shown as the mean ± S.E. of triplicate values. C, solid phase binding assays localizing tropoelastin binding sites on biotinylated fibulin-5. Three of the domain pair fragments, F5-E1+2, F5-E4+5, and F5-E6FC, bound well to immobilized tropoelastin (KD values of 332, 452, and 965 nm, respectively; binding curves are shown in supplemental Fig. S4A), but fragments F5-E2+3 and F5-E5+6 interacted only very weakly. One representative experiment is shown. Data are shown with the negative (biotinylated F5 fragments only) control subtracted. Results are shown as the mean ± S.E. of triplicate values.

