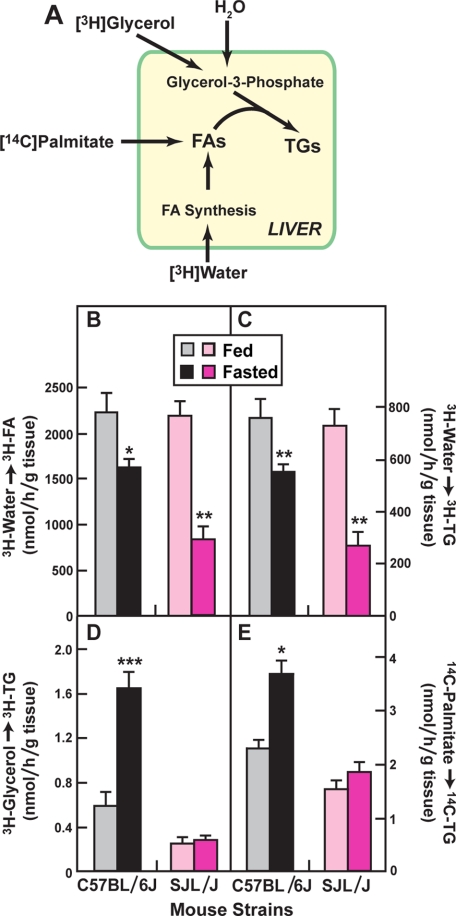
FIGURE 5.
In vivo rates of FA and TG synthesis in livers from fed and fasted C57BL/6J and SJL/J mice. A, schematic diagram of the isotopes used to measure synthesis of FA and TG. B–E, incorporation of [3H]water (B and C), [3H]glycerol (D), and sodium [14C]palmitate-albumin (E) into FA (C), and TG (B, D, E) was measured in living male mice (8–10 weeks of age) as described under “Experimental Procedures.” Each bar represents the mean ± S.E. of values from four mice. Asterisks denote the level of statistical significance between fed and fasted mice of the same strain. *, p < 0.05; **, p < 0.01; ***, p < 0.001. Similar results for D and E were obtained in one other independent experiment. The [3H]water experiments in B and C were done only once.

