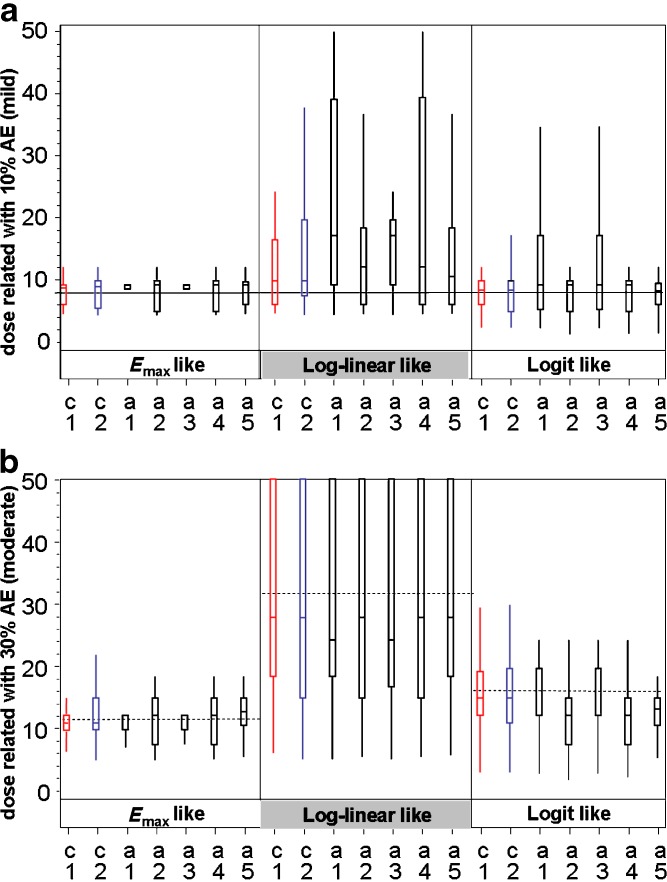
Fig. 3.
Box-plots describing the distribution of estimated doses for AE relationships. For each of the three AE relationships, seven designs are shown. Each box represents 3,000 simulations of the design + distribution situation. Alternative designs (in black) are compared with the 6/2 customary designs (C1 in red and C2 in blue). a distribution of estimated doses to have 10% (mild) AE rate safety target (case of 30%CV for PK): reference line indicates the correct dose for 10% rate (8×). b Distribution of estimated doses to have 30% (mild) AE rate safety target (case of 30% CV for PK): reference lines (dashed) indicate the correct dose for E max-like distribution (11.5×) log-linear (32×) and logit-like relationships (16×). Figures of 50% CV are provided in the Supplementary data. Box-plot description: median line is positioned inside the box. Boxes stretch vertically from the 25th to 75th percentiles of the distribution of values. Whiskers stretch from the box to the second and 98th percentile of the distribution of values

