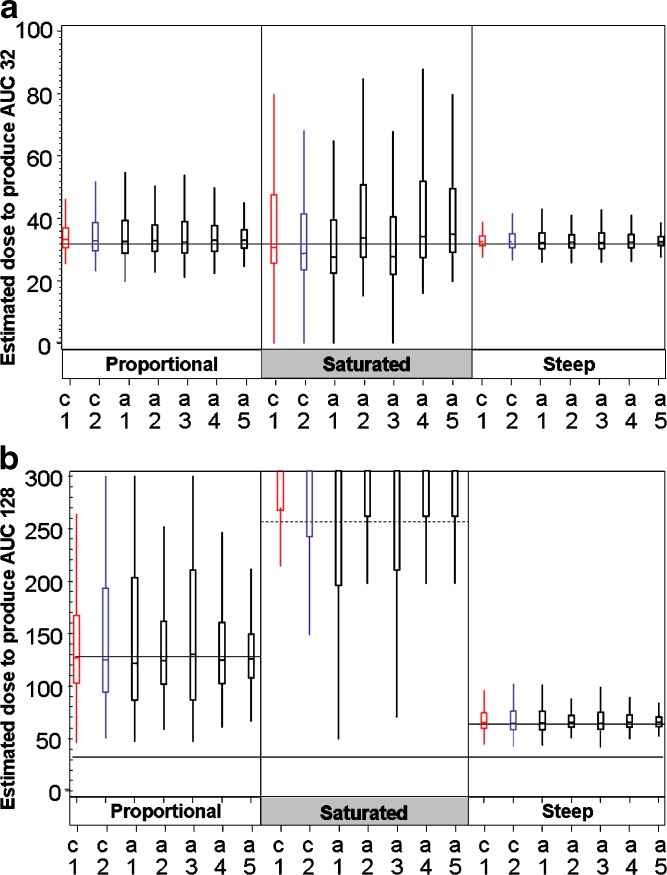
Fig. 4.
Box-plots describing the distribution of estimated doses to produce exposure of AUC = 32 and AUC = 128. For each of the three PK distribution seven designs are compared. Each box represents 3,000 simulations of the design + distribution situation. Alternative designs (in black) are compared with the 6/2 customary designs (C1 in red and C2 in blue) a distribution of estimated doses to produce AUC32 (30% CV) b distribution of estimated doses to have exposure of AUC128 for safety target (30% CV): solid reference lines indicate the correct dose-proportional PK (128×) and steep PK (64×) note that for saturated PK estimated doses to produce AUC128 were above the maximal predetermined dose of the study (256×; dashed line)

