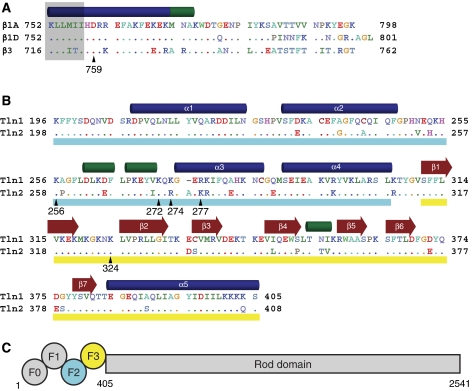
Figure 1.
Integrin and talin sequence comparisons. (A) Sequence of the cytoplasmic tail of the β1A, β1D, and β3 integrins. Residues in β1D and β3 that differ from β1A are highlighted, and a key membrane–proximal aspartate residue is indicated with β1 numbering. Secondary structure (α helices in blue, 310 helices in green) is based on the β1D/talin2 complex structure. Residues embedded in the membrane (Lau et al, 2008b) are shaded in grey. Residues are coloured by chemical properties: acidic residues are shown in red, basic in blue, aliphatic in green, aromatic in cyan, polar in lavender, and others are given unique colouring. (B) Sequence of the F2–F3 domains of talin1 and talin2. Residues in talin2 that differ from talin1 are highlighted, and secondary structure was determined as in (A). The F2 domain is underlined in cyan and the F3 in yellow. (C) A schematic of the domain structure of talin. Talin homodimerization (not shown) occurs at the C-terminus.

