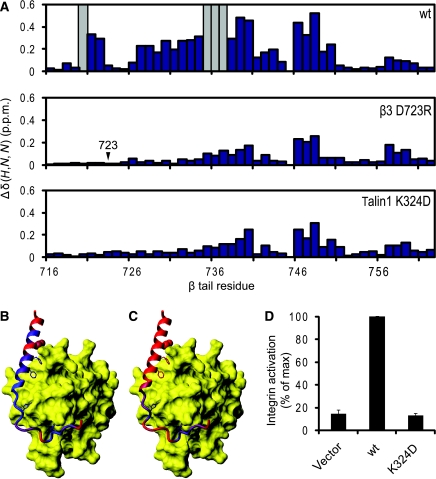
Figure 5.
A key salt bridge between talin and the β integrin tail. (A) Weighted shift maps of perturbations observed in 1H–15N HSQC spectra of the β3 tail on the addition of talin1 F3. Experiments were performed on β3 wt with talin1 wt, β3 D723R with talin1 wt, and β3 wt with talin1 K324D. Grey bars correspond to residues that could not be tracked because of exchange broadening. (B) Chemical shift perturbations in β3 on binding to talin1 F3 wt domain mapped onto the β1D/talin2 structure (largest shifts in blue, smallest in red). (C) As in (B) but with β3 D723R. (D) As in Figure 3A, but exploring the effect of talin1 F0–F1–F2–F3 wt or K324D on activation of αIIbβ3 expressed in CHO cells.

