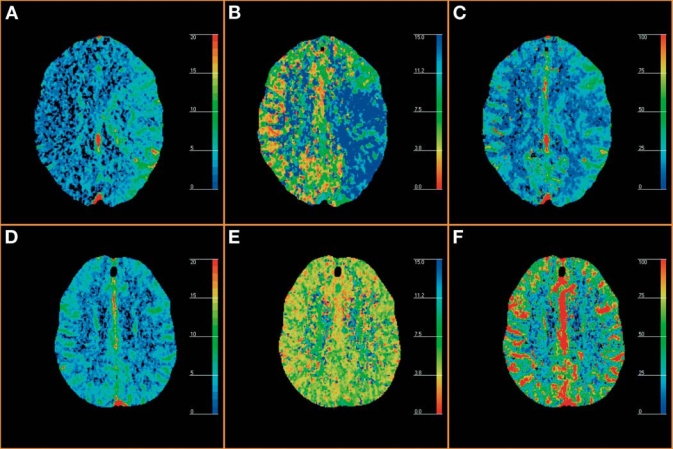
Fig. 1.

PCT was performed to determine if the patient was at risk for cerebral infarction and whether transluminal angioplasty should be performed or not (A–C) and was repeated after angioplasty to monitor treatment effects on cerebral perfusion (D–F). (A) Preangioplasty PCT CBV map demonstrates increased CBV values in the left hemisphere, consistent with ischemia-related activation of cerebral autoregulation (blue to red: CBV = 0 to 20 mL/100g). (B) Preangioplasty PCT MTT map demonstrates increased MTT values in the left hemisphere, consistent with ischemia-related activation of cerebral autoregulation (red to blue: MTT = 0 to 15 seconds). (C) Preangioplasty PCT CBF map demonstrates normal to decreased CBF values in the left hemisphere (blue to red: CBF = 0 to 100 mL per 100 g and per minute). (D) Postangioplasty PCT CBV map demonstrates normalized CBV values in the left hemisphere, symmetric to the normal right side. (E) Postangioplasty perfusion CT MTT map demonstrates normalized MTT values in the left hemisphere, symmetric to the normal right side. (F) Postangioplasty PCT CBF map demonstrates normalized CBF values in the left hemisphere, symmetric to the normal right side.
