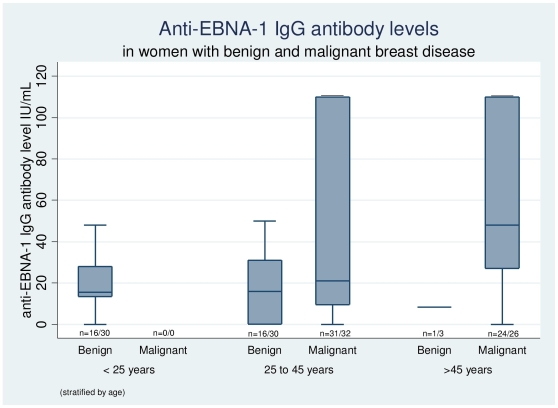
Figure 2. Box plot showing anti-EBNA-1 IgG antibody levels in women with benign and malignant breast disease, stratified by age.
The central horizontal line in the box indicates the median value, edges of the box indicate inter-quartile range, and the whiskers indicate values at 5th and 95th percentiles. The values at the bottom of the box indicate the number of women in whom serology was done, out of the total number of eligible women in particular category. The mean IgG levels in 25 to 45 year age group were significantly higher in women with malignant breast disease (48.15; SD 47.38 IU/ml) as compared to those with benign breast disease (17.37; SD 16.89 IU/mL) (p = 0.01).

