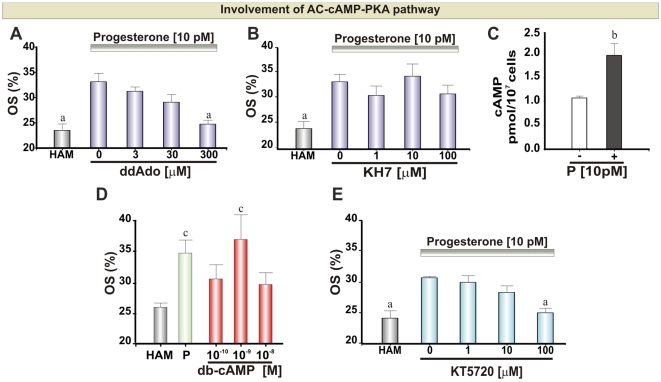
Figure 1. AC-cAMP-PKA pathway during sperm chemotaxis mediated by P.
A, B and E: Percentage of oriented spermatozoa (OS) towards 10 pM P gradient after treating the cells with ddAdo (15 min), KH7 (15 min) and KT5720 (5 min), respectively. C: cAMP intracellular concentration in the absence or presence of 10 pM P. D: Percentage of oriented spermatozoa towards db-cAMP. HAM was assayed as a negative control. Each bar represents the mean ± SEM. a Significant differences vs. without inhibitor (p<0.05). b Significant differences vs. without P (p<0.05). c Significant differences vs. HAM (p<0.05).

