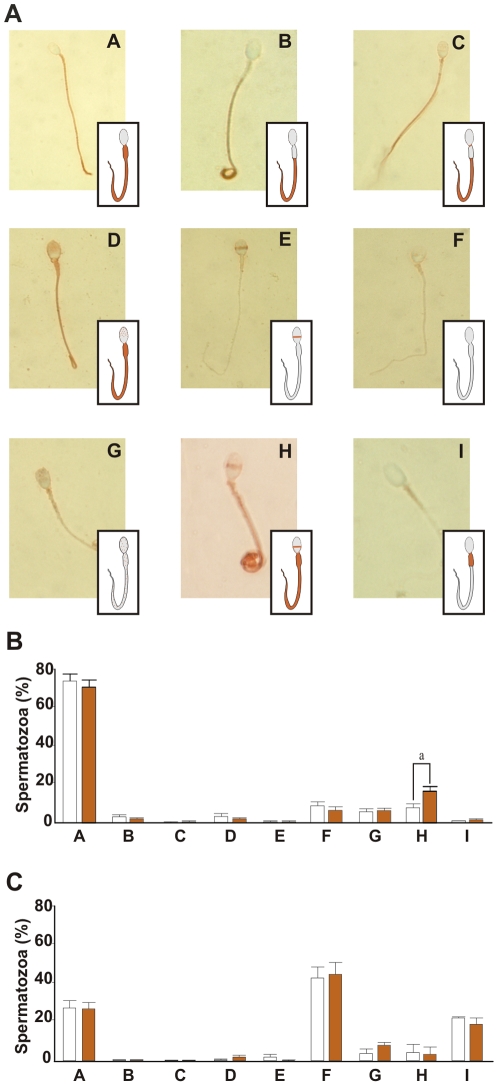
Figure 4. Sperm protein tyrosine phosphorylation.
A: Immunocytochemistry for protein Tyr-phosphorylation in the absence or presence of a 10 pM P gradient. A flagellum; B principal and end piece; C neck, principal and end piece; D punctuate staining of the acrosome region and flagellum; E equatorial band; F no label; G punctuate staining of the whole spermatozoon; H equatorial band and flagellum; I midpiece. Percentage of each identified pattern of Tyr-phosphorylation after treating the cells with (dark) or without (white) 10 pM P gradient in: (B) spermatozoa incubated under capacitating or (C), non-capacitating conditions. Data are expressed as the mean ± SEM. a Significant differences vs. without P (p<0.05).

