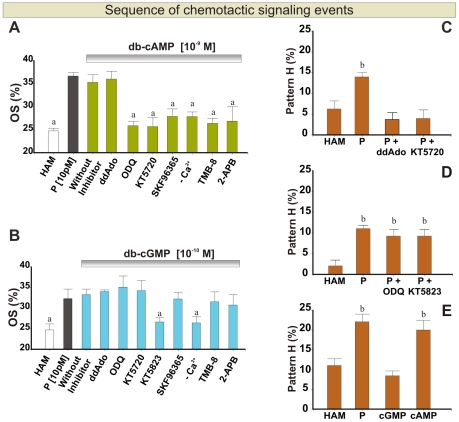
Figure 5. Sequence of chemotactic signaling events.
A and B: Percentage of oriented spermatozoa (OS) towards: (A) 10−9 M db-cAMP or (B) 10−10 M db-cGMP gradient in the presence of effective doses of the following inhibitors ddAdo (300 µM), ODQ (30 µM), KT5720 (100 µM), SKF96365 (50 µM), sEBSS medium without calcium, TMB-8 (10 µM); 2-APB (50 µM) and KT5823 (10 µM). C and D: Percentage of spermatozoa showing protein Tyr-phosphorylation pattern “H” after exposure to 10 pM P gradient and pre-treated with (C) ddAdo (300 µM) or KT5720 (100 µM) inhibitors and (D) ODQ (30 µM) or KT5823 (10 µM) inhibitors. E: Percentage of cells showing pattern “H” after exposure to 10 pM P, 10−9 M db-cAMP or 10−10 M db-cGMP gradient. HAM was assayed as a negative control. Data are expressed as the mean ± SEM. a Significant differences vs. without inhibitor (p<0.05). b Significant differences vs. HAM (p<0.05).

