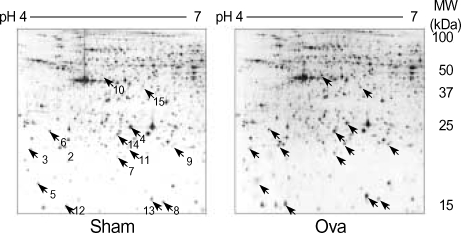
Fig. 3.
2-DE of proteins from normal (Sham) and allergic asthma (OVA) mouse lung tissues. In the first dimension, proteins were loaded on a 24-cm IPG strip with a linear gradient of pH 4-7. A 12% SDS polyacrylamide gel was used for second dimension separation. Proteins were visualized by silver staining. Indicated spots represent proteins differentially expressed between normal and asthmatic lung tissues.

