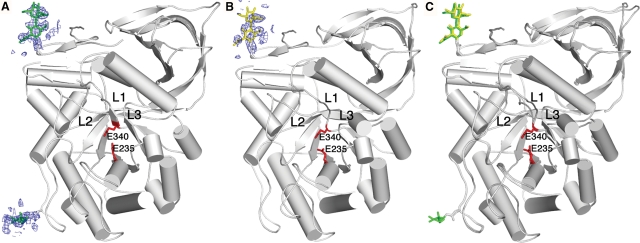
Fig. 6.
Glycosylation sites seen in the crystal structure of velaglucerase alfa. 2Fo–Fc electron density maps are shown, which are contoured at 1.2σ in the vicinity of two of the putative glycosylation sites, N19 and N146 for molecule A, and N19 for molecule B. (A) Glycosylation sites detected in molecule A are shown in green. (B) Glycosylation site detected in molecule B is shown in yellow. (C) Superposition of the two individual molecules in the asymmetric unit reveals their similarity. In all three representations, catalytic residues E235 and E340 are shown as red sticks.

