Fig. 3.
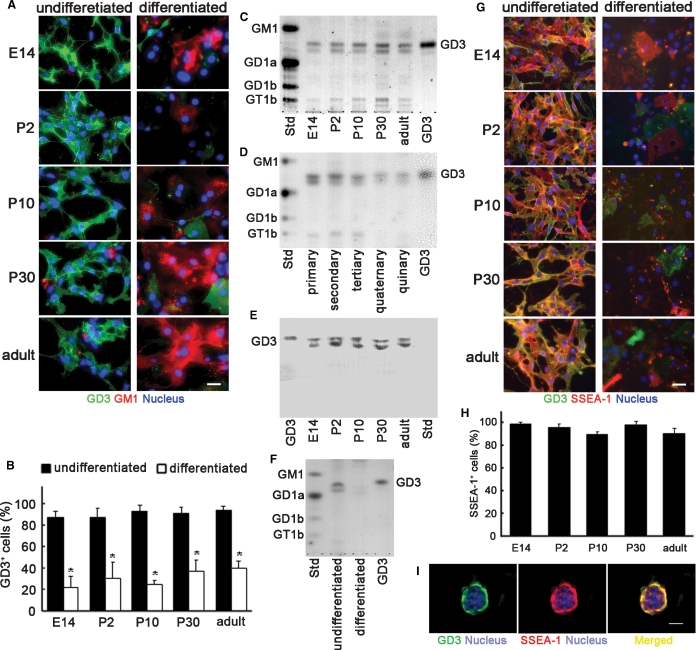
Expression of GD3 in NSCs. (A) Expression of GD3 and GM1 in NSCs and the differentiated cells. (B) The percentages of GD3+ cells in NSCs and the differentiated cells (n = 8–11). (C) TLC of total lipids extracted from embryonic, postnatal, and adult neurospheres. (D) TLC of total lipids extracted from primary, secondary, tertiary, quaternary, and quinary neurospheres. (E) TLC-immunostaining of total lipids extracted from neurospheres with an R24 anti-GD3 monoclonal antibody. (F) TLC of total lipids extracted from differentiated cells derived from neurospheres. In panels (C)–(F), bovine brain gangliosides (Std; GM1, GD1a, GD1b, and GT1b) and authentic GD3 were used as standard gangliosides. In panels (C), (D), and (F), gangliosides were visualized with the resorcinol-HCl reagent. Gangliosides prepared from the same number of cells were applied to each lane. (G) Double-immunostaining of NSCs prepared from embryonic, postnatal, and adult neurospheres with the R24 anti-GD3 monoclonal antibody and AK97 anti-SSEA-1 monoclonal antibody. (H) The percentage of SSEA-1+ cells in GD3+ NSCs prepared from embryonic, postnatal, and adult neurospheres (n = 10). (I) Double-immunostaining of a neurosphere from adult mouse brain tissue with the anti-GD3 antibody and anti-SSEA-1 antibody. In panels (A), (G), and (I), scale bars represent 100 μm. Nuclei were stained with H33258.

