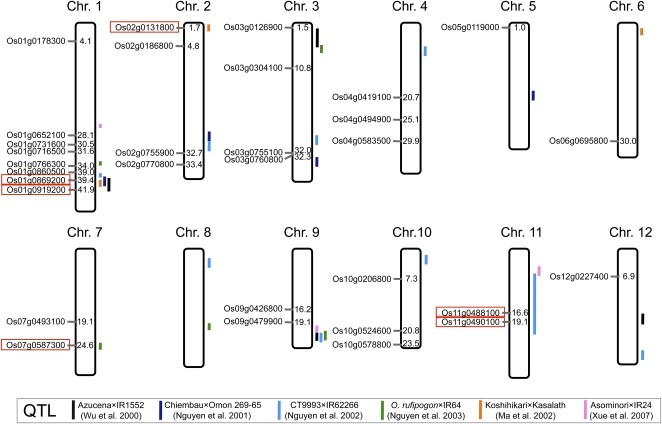
Figure 5.
Position of Candidate Genes Regulated by ART1 and QTLs for Al Tolerance.
Values indicate position of genes on each chromosome (Mb), and QTLs found by different studies are indicated by colored lines. Genes located at a similar position to the QTL are indicated with red boxes.
[See online article for color version of this figure.]

