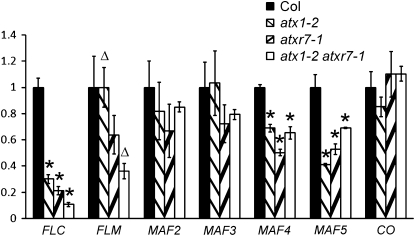
Figure 2.
Expression Level of FLC and FLC-Related Family Genes in H3K4 Methylase Mutants.
Real-time PCR was performed to analyze expression levels. Because there were no significant differences between the results of atxr7-1 and atxr7-2, data from atxr7-1 are presented. The averages of the results from three different biological replicates are shown. Each experiment was normalized to ACTIN2 expression. Bars indicate the se. Asterisks above the bars indicate the significant differences in the expression levels of the genes between Col and mutants (P < 0.05). Triangles indicate the significant difference in the FLM expression level between atx1-2 and atx1-2 atxr7-1 (P = 0.017).

