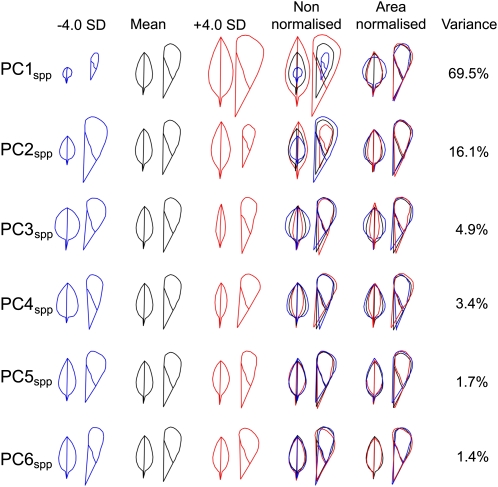
Figure 3.
An Organ Allometry Model for the Antirrhinum Species Group.
Variation in leaves and petals is described by variation along the first six PCs of a combined leaf and petal allometry model. The effects on the leaf and petal outlines corresponding to decreasing or increasing each PC by four standard deviations from the mean for all 177 species samples are shown on the left. Overlaid outlines are shown to the right, after adjusting to the same area (Area Normalized), to illustrate the effects of each PC on organ shape, or without normalization (Non-normalized). The proportion of the total variance in organ shape and size within the species group that is captured by each PC is given as a percentage.
[See online article for color version of this figure.]

