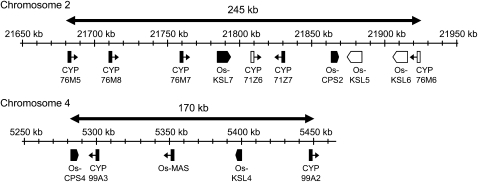
Figure 2.
Schematic of Rice Diterpenoid Biosynthetic Gene Cluster.
Black boxes represent genes induced by chitin elicitation, while white boxes represent those not induced (Okada et al., 2007), with the arrowheads representing the direction of transcription. Note that no other genes appear to be present in these regions.

