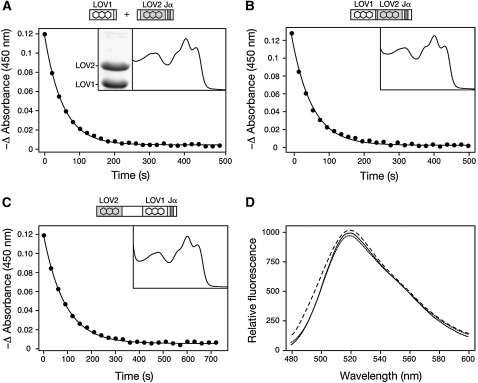
Figure 3.
Impact of the LOV Linker Region and LOV Domain Positioning on phot1 Photoreactivity.
(A) Dark recovery after light excitation measured at 450 nm for a mixed population of LOV1 and LOV2 domains. Decay fits to a single exponential with a half-life of 37 s. The absorption spectrum is shown (inset) alongside a Coomassie blue–stained SDS-PAGE gel showing equal protein levels.
(B) Dark recovery after light excitation measured at 450 nm for LOV1+2 lacking the intervening linker region. Decay fits to a single exponential with a half-life of 60 s. Absorption spectrum is shown (inset).
(C) Dark recovery after light excitation measured at 450 nm for the LOV2+1 domain-swap protein. Decay fits to a single exponential with a half-life of 60 s. Absorption spectrum is shown (inset). In each case, protein concentrations were 2 mg mL−1.
(D) Fluorescence emission spectra of flavin fluorescence released upon denaturation of equal concentrations (0.4 mg mL−1) of wild-type LOV1+2 (solid line), LOV2+1 (dotted line), and LOV1+2 lacking the intervening linker region (dashed line).

